
In the previous post we covered what
uptime was:
Being able to serve your customers with the functionality offered by your service at the
moment the customer wants to use that service.
We briefly touched on how uptime is communicated to your customers, in this post we explore this
further, specifically uptime as a percentage and how this relates to SLOs/SLAs.
The ‘nines’ uptime measure
Often we hear the ‘number of nines’ used as a unit of representation of the uptime
of a service. For example:
“We offer four nines of availability”
But what does that actually mean?
Saying ‘four nines’ means 99.99% - you simply count the number of nines in the
percentage figure given. People say ‘four nines’ because saying out loud
(verbally) “ninety nine point nine nine percent” is a bit of a mouthful! Similarly
if a service does not offer a full nine, you may say ‘three and a half nines’ or
‘three nines five’, which would both equate to 99.95%. The more nines that you
offer the more availability you offer, and the less downtime. So how do all these nines
translate to reality?
The percentage given is a representation of service uptime relative to a time period. The table
below is a quick reference of some of the common ‘nines’ and how that represents
uptime (or downtime) over the periods of time. This is non-exhaustive; it’s just a sample
of the common ‘nines’ and common periods of time in which availability is measured
over.
| Availability |
Downtime per Week |
Downtime per Month |
Downtime per Year |
| 99% (two nines) |
1.68 hours |
7.31 hours |
3.65 days |
| 99.9% (three nines) |
10.08 minutes |
43.83 minutes |
8.77 hours |
| 99.95% (three and a half nines) |
5.04 minutes |
21.92 minutes |
4.38 hours |
| 99.99% (four nines) |
1.01 minutes |
4.38 minutes |
52.60 minutes |
| 99.999% (five nines) |
6.05 seconds |
26.30 seconds |
5.26 minutes |
The reason why availability is often measured (or promised) over longer periods of time (days,
weeks, months) is to allow a more relatable and sensible representation of availability. The
more granular your measurement window, the less representative (and less useful) it becomes. In
the presence of any downtime or errors in a service, if you measure that over a smaller time
period in which those errors occur, you exaggerate the reality of the uptime/availability. To
explain this let us work through an example scenario:
Imagine a website that has an uptime of 99.9% over 24 hours. This allows for 86.4 seconds (1.44
minutes) of downtime per day. Let us say this website has an error and the process which serves
web pages had to restart at 01:31:25 AM, and it took 30s. We can calculate this availability by
the following formula:
Measuring uptime as a percentage
Measurement Period of time − downtime
Measurement Period of time
× 100
Measurement Period of time (in seconds) = 24 (hours) × 60 (minutes) × 60 (seconds) =
86,400 seconds
Downtime = 30s
= 0.99965278 × 100 = 99.96527778% uptime
Given we have a 99.9% uptime promise, the figure of 99.9652 exceeds that, and so we are within
our availability promise.
However, if you change the time of evaluation parameters of that promise, and a discerning
customer challenges you on a custom time range measuring availability between 01:25 AM and 01:35
AM, then the observed uptime of that service would change drastically:
01:25 → 01:35 is 10 minutes ~ 600 seconds
Total time is 600
Downtime is 30s
= 0.95 × 100 = 95% Uptime
As shown above, the measured availability of your service will change based on the time span
observation period. This is why when making promises to your customers on availability, it is
important to stipulate that availability over a suitable measure of time. A percentage
availability figure without an accompanying time period of measurement is not a functional
representation of your uptime promise. This is why SLOs and SLAs always include time periods of
uptime evaluation.
What are SLIs, SLOs and SLAs, and how do they relate to uptime?
SLI: Service Level Indicator
This is your raw data. It is the mechanical part, often it’s a number calculated from one
or more metrics, user journeys, or timing elements. There is no promise or target attached to an
SLI, that is the job of a SLO. Examples of an SLI include: Number of HTTP requests successfully
processed as a percentage of overall requests, or Average Latency in serving HTTP requests.
SLO: Service Level Objective
In the context of service availability/uptime, this is the targeted uptime figure for a period of
time. It’s the figure that the service provider attempts to meet.
It’s factual and calculated from numbers. Your service either meets it or it does not. A
Service Level Objective is calculated from a Service Level Indicator. Examples include: Over
99.99% of requests being processed successfully.
SLA: Service Level Agreement
This is the agreement that you have with your customers as part of your contract. This is the
accountability and punishment and (possibly) remuneration part. The service level agreement
builds upon the service level objectives, but crucially it will cover what happens, or what the
customer should expect, should those objectives not be met. Often when/if a SLO is not met, or
broken, the customer should expect something in return to help soften the blow of an
unmet SLO. This could be in the form of some sort of remuneration or service credits, or in more
severe circumstances it could allow the customer an early exit of a contract. The cost of
breaking an SLA with your customers should be painful enough to be a strong incentive for the
service provider to adhere to that agreement. If the cost of breaking an SLA is not meaningful,
there is no incentive to adhere to it.
Measuring availability as percentages - time or executions
There are a few different ways in which you can build your SLOs, the two that I’ll focus
on in this section are intent-based SLIs and time-based SLIs.
Intent-based SLIs are calculated per action customer intent - which is usually
an action of some sort which provides the customer value. For example: per payment, or per page
visit, or per HTTP request. These SLIs record the actual result of a customer
interaction.
Example 1: When a customer in a shop (or online) goes to pay for something, does
that payment go through or not.
Example 2: When a user visits a website, does that web page load when requested
or not.
Putting Example 1 into the uptime (or availability) formula looks like this:
Total number of payment attempts − failed payments
Total number of payment attempts
× 100
Here is an example with actual numbers:
500 attempts − 4 failed attempts = 496
500 attempts
× 100 = 99.2% uptime
This is the ultimate form of measuring availability to a customer, it records actual
uptime/downtime as witnessed by the user, it’s not derived or a proxy to
impact, it is actual impact and it’s the gold standard.
The problem with capturing the result of each intent (especially on web based services) is that
it is fairly hard to capture this detail with 100% accuracy unless you control/own the entire
end-to-end user interaction.
Take for example a web server that serves HTML web pages (like this blog post you are reading),
the user intent is obvious - user visits the URL via a web browser, which performs a HTTP
request, and the web server responds to that request. The user intent starts with the web
browser - which the service provider does not control, nor is it easily observable. Only when
the request reaches the web server is the service provider able to ‘know’ that a
user intent has happened - and therefore can be recorded with a success or failure outcome. But
what happens if your web server reboots, or DNS misconfiguration leaves your web service
unroutable? If our web server is unable to accept requests, how do we know how many user intents
have failed during that reboot or DNS misconfiguration? The answer is you
don’t and so capturing exactly the outcome of each user’s intent is
often impossible.
If you do have more control over the end to end interaction; then good for you. It is possible to
capture the outcome of each user intent more accurately. For example if your service has some
form of client SDK or client application installed on a user’s device, e.g. an iPhone
app, then you can attempt to record these attempts via telemetry installed on the client facing
application. You can record the status code of each HTTP request and count successful HTTP
status code ranges (2xx) as successfully satisfied user intents and 5xx range error codes as
failures (down).
This is not without problems however - what happens if there is no status code, or the request
times out (status code 0)? Telemetry and recording of your services’ uptime from a client
controlled device can cause misrepresentations in your service’s uptime,
and can often mean you start recording the availability of the internet. There are a
lot of 3rd party services sitting between your customer and your service - the internet for one!
Don’t promise internet availability with your service, you don’t control it.
Whilst it may be tempting to think ‘an end user intent which fails is still a
failure’ - which is technically right, a SLO/SLA that is based on a 3rd party service
which you the service provider cannot hold to account is a dangerous thing. If your
customer’s way of interacting with your service is via a mobile phone client application
- e.g. an app installed on their phone, what happens if/when the mobile carrier/network has
problems? Should your particular service SLO take a hit from that 3rd party failure that you
have no connection with or agency over? No, that would be a misrepresentation of
your service uptime.
SLAs and accountabilit:
Service Level Objectives (and agreements) should only be built upon indicators that your service
is accountable for. This does not mean ‘in control of’, it means accountable for.
If your API/Service is hosted on a cloud provider, e.g. AWS, you are
accountable for the downtime of those cloud resources e.g. DynamoDB,
PostgreSQL, EC2, ALBs - as you chose to build your service on them. But you are
not responsible for them, AWS is. You have a service agreement with AWS, and you hold Amazon to
account for the uptime of those services. It is not acceptable to discount or exclude downtime
of your services’ dependencies unless you explicitly mention this within your SLA. If you
use AWS/Azure, and those cloud providers have downtime which affects your service, that downtime
is your downtime.
We do not want to build our SLIs on third parties that we cannot hold to account, but we want to
capture the result of customer intents as it is a gold standard for the user’s real-world
experience. This causes somewhat of a quandary, and like most of the important dilemmas in
systems engineering it comes down to compromise.
Measuring from the first reasonable point of control or accountability is a sound
strategy. Following on from the previous examples, in a web app/web service this is likely to be
the first layer 7 HTTP server/proxy/load balancer/API gateway logically closest to the
customer. See an example using AWS components in the diagram below:
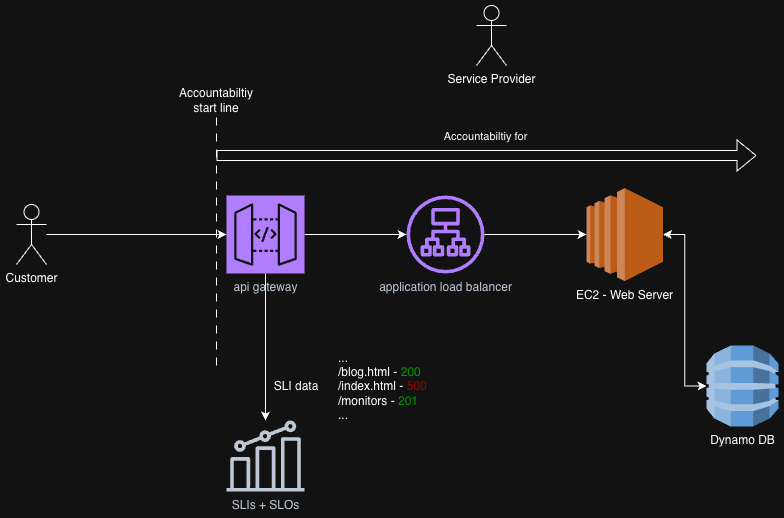
This is a compromise as it does not cover DNS routing problems, or API gateway
unavailability/misconfiguration, but it does give granular success/failure metrics on a
per-user-intent basis, which is a high fidelity indicator.
In the above example the API Gateway is the observability point for the provided service. It is
layer 7 aware, and so it can observe and record HTTP status codes, which we can convert into
availability. The API Gateway therefore has an important job, and it should be one of the
highest availability components in your system. You should not offer an availability SLA higher
than the lowest availability component in your system.
The reason why you should not offer a higher availability SLA than your weakest component is
because if every service you rely on behaves as expected, you could still be in breach of your
SLA agreement. For example, if your database service has an advertised SLA of 99.9% uptime and
you offer your customers 99.999% uptime, you require your database to exceed its offered SLA in
order to keep your SLA promise with your customers. That’s a risky place to be, because
it means you may be breaking a promise to your customers every week/month, which will definitely
be a reputation hit, and may come with financial penalties - depending on how your SLA is
constructed.
One such company that offers an SLA higher than is achievable is Cloudflare. They offer a 100%
uptime guarantee. What’s interesting with this offering is that Cloudflare have chosen to
‘take the hit’ and be punished for downtime. 100% uptime is unrealistic, and
Cloudflare know that, but they have chosen this SLA policy strategically as a value add.
However, it prompts the question - is this SLA policy an indication of their service
stability/uptime, or is it an indication of what they are prepared to pay to win your custom?
Does a service provider offering a (unrealistic) 100% uptime give you more or less confidence
than a service provider offering a 99.99% uptime? Would you choose to invest in an ETF that
promised 100% year on year gains, or 6% year on year gains?
Set your service SLA carefully based on the SLA of the services that you build your product on.
Breaking SLA should be a rare and severe event; a service provider should be held to account for
an SLA breach with consequences painful enough to incentivise genuine improvement after every
breach.
